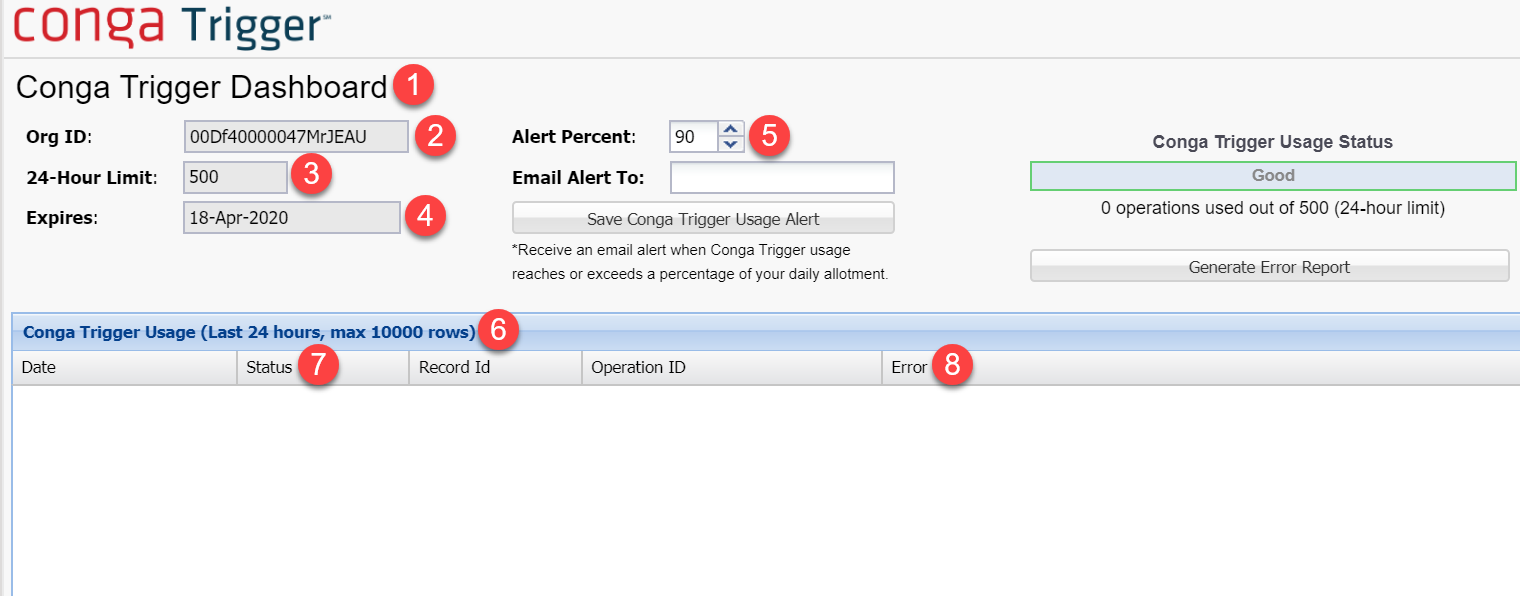
The Conga Trigger Dashboard tab monitors Conga Trigger events and lists errors for any records that failed to process.
1
The Conga Trigger Dashboard tab.
2
Org ID displays the Salesforce Organization ID.
3
24-Hour Limit is the number of Conga Trigger service events allowed per 24 hour period according to your Conga Trigger subscription and configuration.
4
Expires displays the Conga Trigger subscription expiration date.
5
Alert Percent is the percentage of usage.
Known Issue
The system does not send an email to the participant listed in the Email Alert To field when the percentage is reached.
6
The Usage Detail (Last 24 Hours) area displays details of the Conga Trigger events that ran successfully in the last 24 hours.
7
Conga Trigger Usage Status displays the number of Conga Trigger service events that have been consumed as well as the total number allowed per 24 hour period.
8
The Error List area displays details of records that have failed to run in Conga Trigger in the last 24 hours.
The Record Id column displays the Master Object ID of the record within a Conga Batch that failed.
The Error column displays the error message, providing details of why that particular record failed.