Reports & Dashboards provides pre-defined reports and dashboards customized for Conga CLM users. Currently, there are four reports designed for Conga CLM users.
Key features:
Run a report
Download a report in CSV, Excel, and PDF format
Sort data based on column values
Apply filters based on column values
Reports
Conga CLM contains the following pre-defined reports.
Field
Description
Contract Cycle Time Report
Displays average time taken for contracts to move from one stage to another. Displays the data based on record type and stage
High Risk Contract Report
Lists the contracts with high risk
High Value Contracts Due for Renewal
Lists the contracts with high value due for renewal
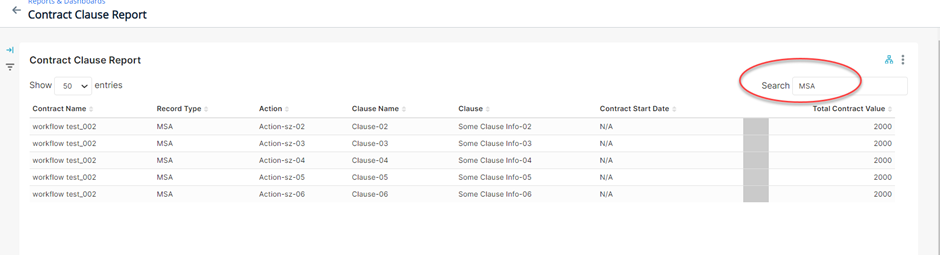
Contract Clause Report
Lists the contracts containing clauses
Contacts with Non-standard Legal Language
Lists the contracts containing non-standard legal language
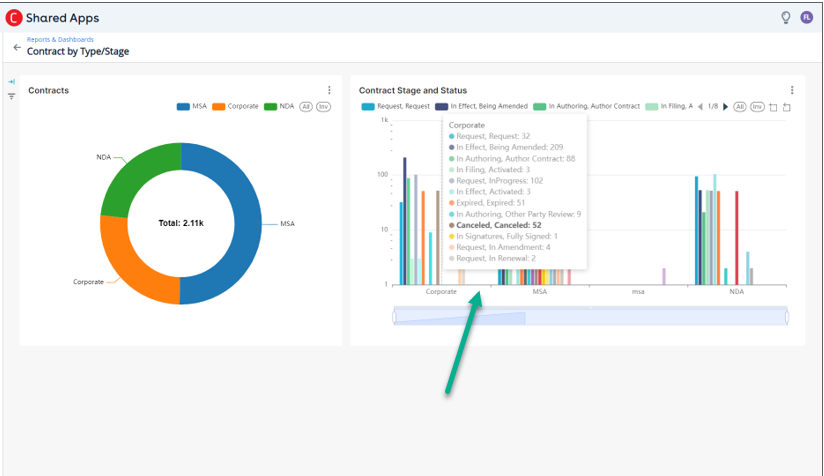
Contract by Type/Stage/Value
Lists the contracts by type or stage along with contract value
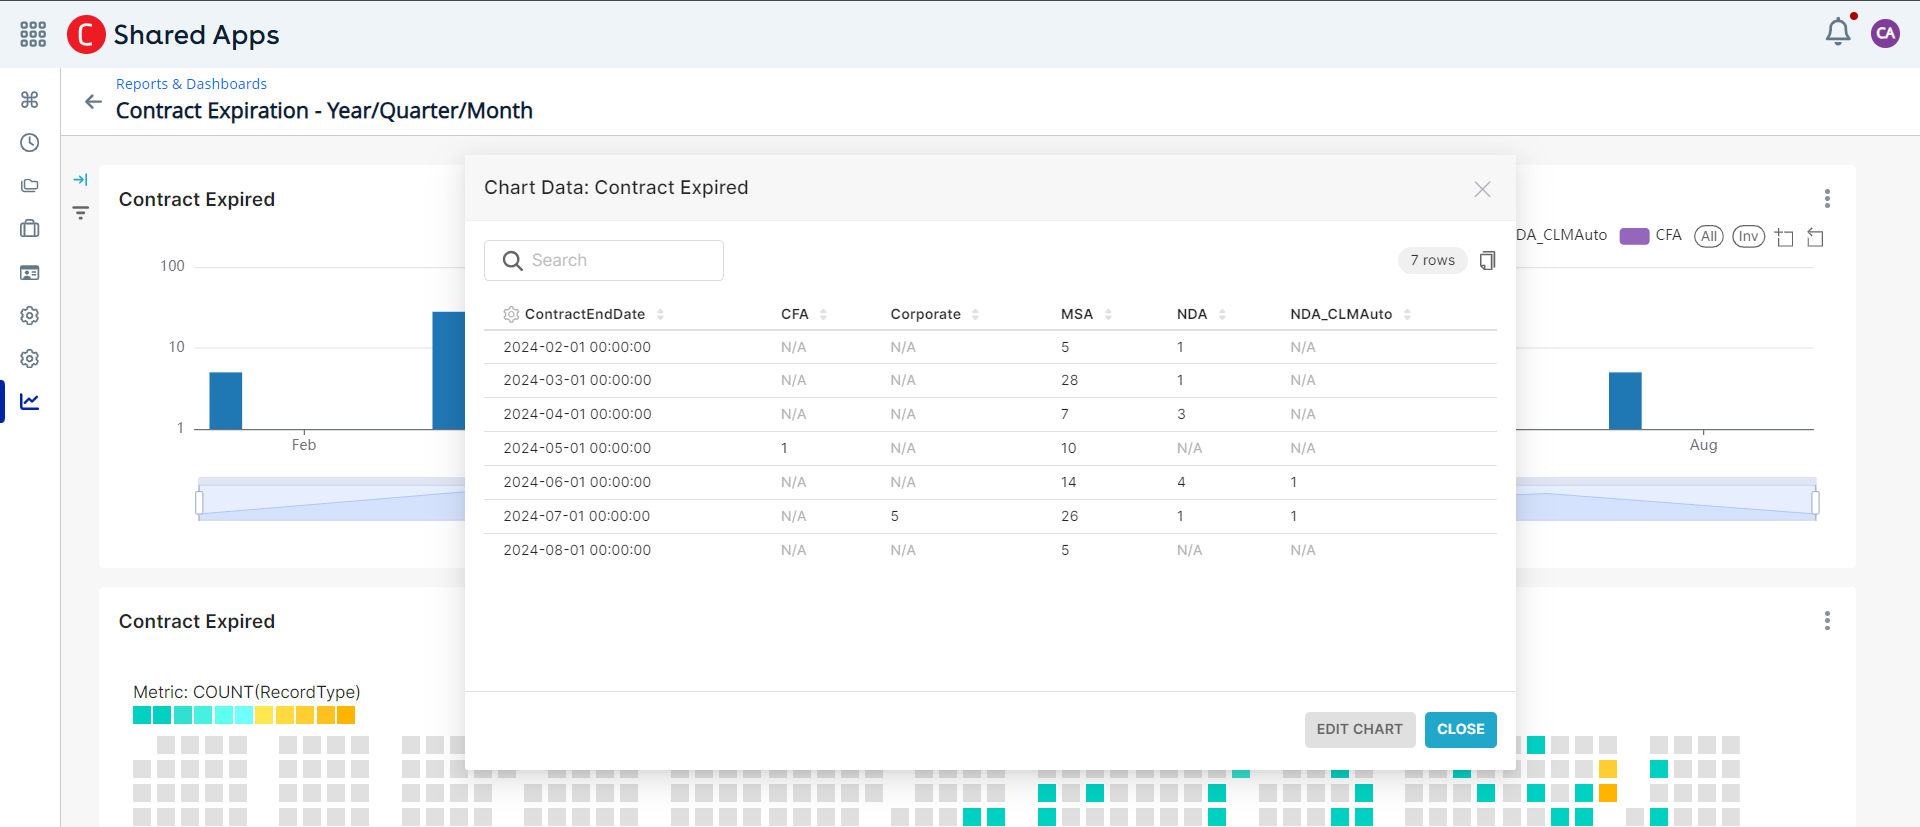
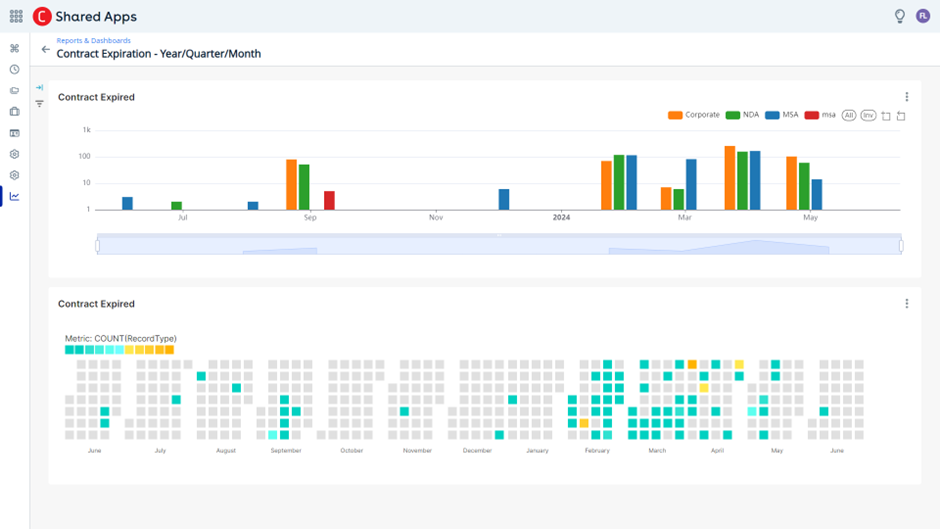
Contract Expiration - Year/Quarter/Month
Lists the contracts expiring this year, quarter, or month
Dashboards
Dashboards display key statistics in an understandable format, allowing you to gain insight to fulfill your business needs. The data from reports are displayed on Dashboards in visual formats, for example, charts, tables, or metrics. A report returns a set of records that meets certain criteria and displays it in organized rows and columns. The report data can be filtered, grouped, and displayed graphically as a chart or a table.
To access Reports and Dashboards
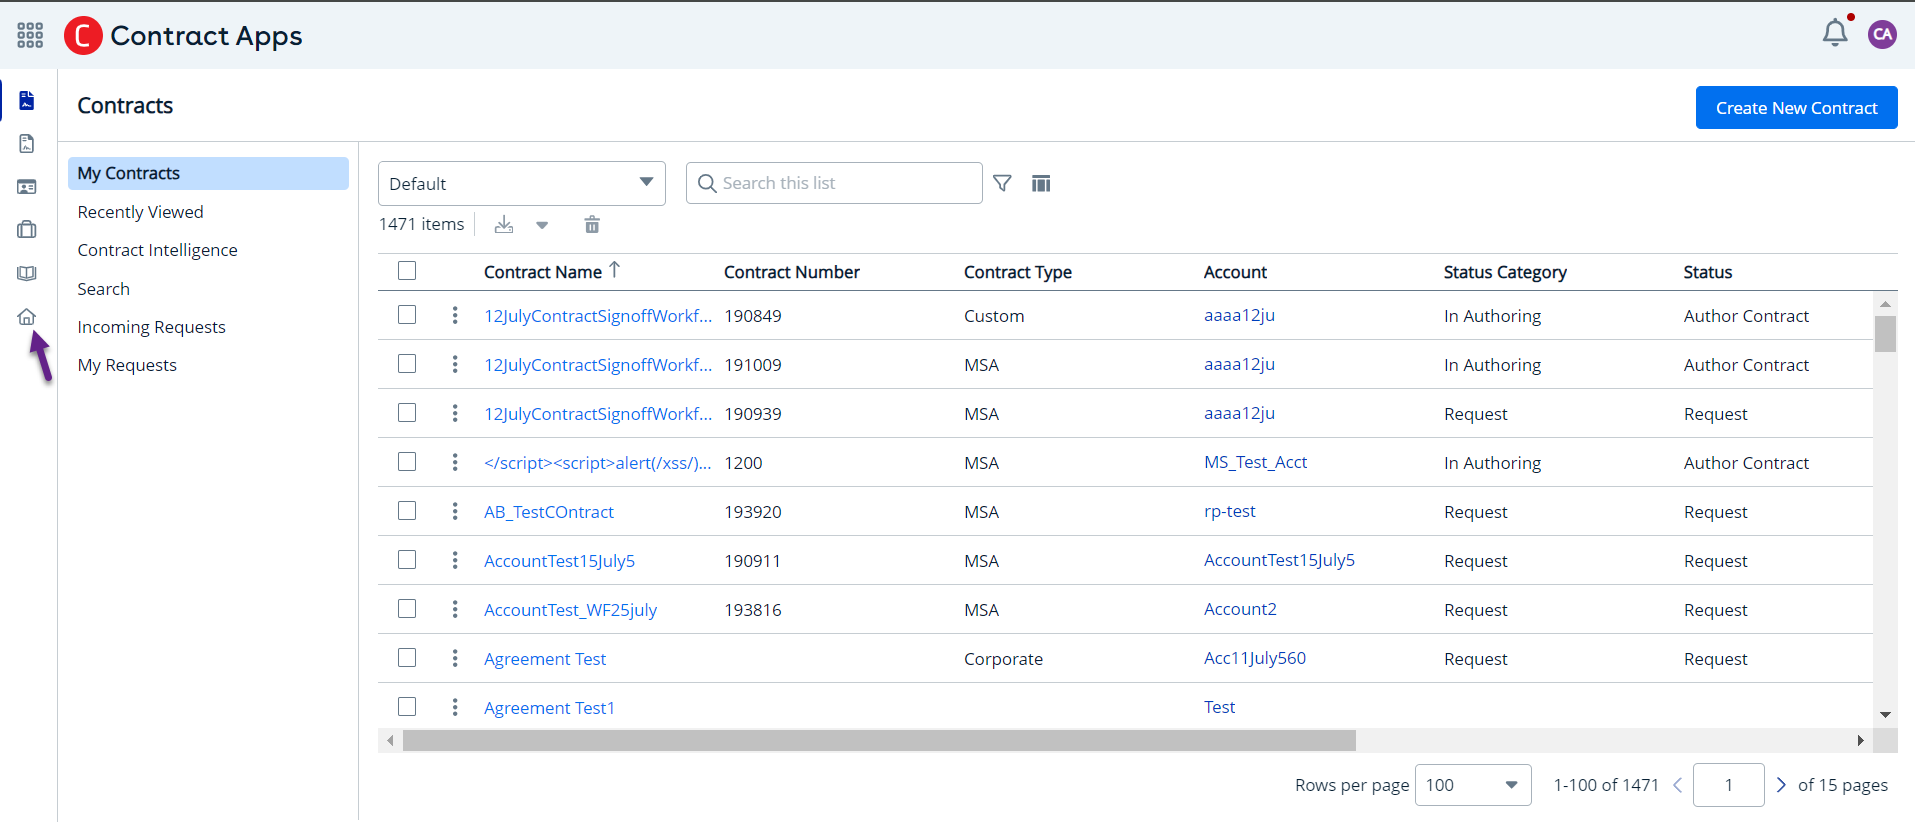
Click App Launcher () icon.
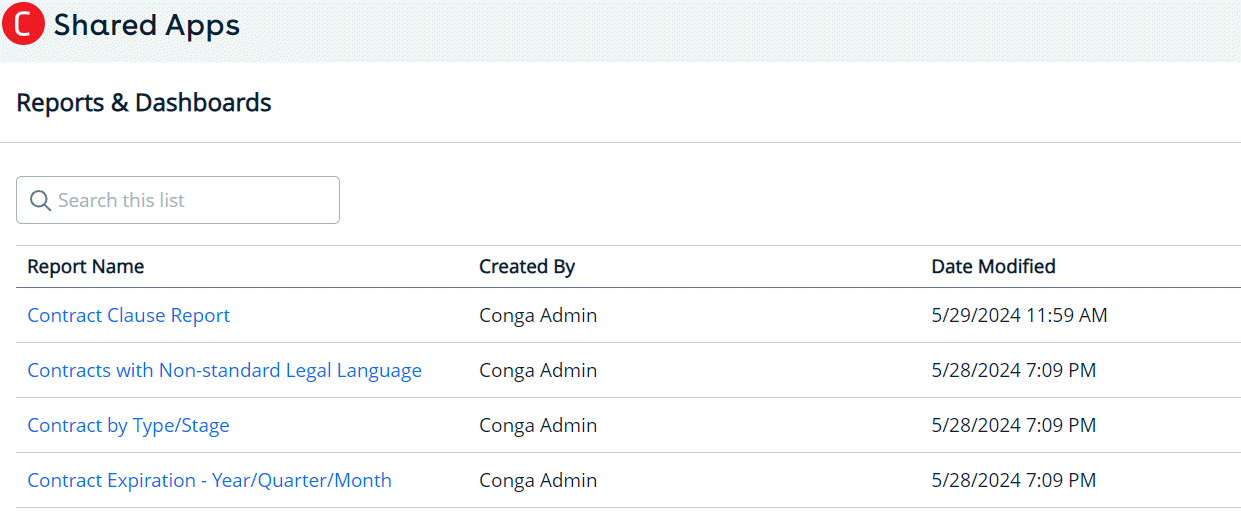
Click Reports and Dashboards from Shared Apps. This opens the Reports & Dashboards page with the pre-defined reports. (Or) Click App Launcher () icon and select Contract Apps > CLM Dashboard () icon to open the Reports & Dashboards page.
Click the report name link to open its dedicated dashboard. On the dashboard, you have the flexibility to:
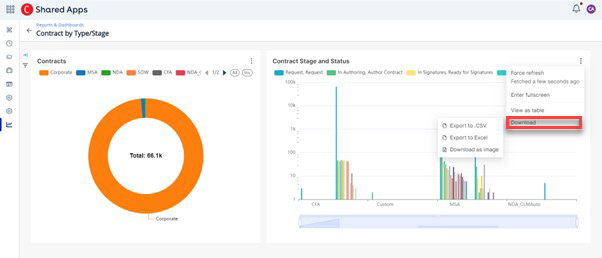
Apply filters: Apply filters to display specific fields by refining your data view within the report. For example, to filter Corporate records by type or stage, click the Contract by Type/Stage link, select the filter icon () and select Corporate to apply filters. You can view the Corporate records as shown in the following image.
Sort data: Sort any available column and organize the dashboard information.
Display as table: View the reports as list view or in table format.
Download: Export the reports in various file formats, such as image, Excel, or CSV (comma-separated values), for further analysis or sharing.
Search data: Search for specific data in a report
Display charts: Different charts (Pie, Bar, Line, Histogram, Funnel, Scatterplot, Summaries) are displayed that graphically show your custom report data. Hover your mouse over a chart to display the details.