How to add a table to a PowerPoint template.
For arranging data in columns and rows, you'll find Table-based detail regions particularly useful. You create a table including column headers and a row to hold your merge fields. Conga will automatically expand the table to accommodate the number of rows in your dataset.
To add a table to a PowerPoint Template:
- In your PPTX template, create a table with at least two rows (one for column headers and the other for merge fields) and as many columns as necessary to accommodate your data.
- In your Template Builder window, locate a field from a dataset that may contain multiple rows of data.
- Copy it to the clipboard.
- Switch to PowerPoint and move to the first cell in the row that will contain your merge fields.
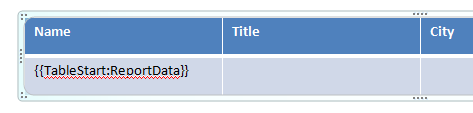
- To mark the beginning of the Detail Region, create a merge field with the name
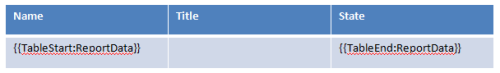
{{TableStart:DatasetName}} where DatasetName corresponds to the name of the dataset from the Template Builder window. - To mark the end of the Detail Region, in the last cell of the row, create a merge field with the name
{{TableEnd:DatasetName}} where DatasetName corresponds to the name of the dataset from the Template Builder window.
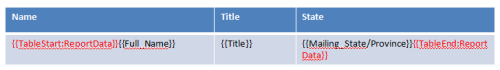
- Between the TableStart and TableEnd fields, place merge fields that correspond to the fields of your report data.
These merge fields will be populated with data from the first row of the detail data, then the whole region will be repeated, the new fields will be populated with data from the second row, and so on.
This table:
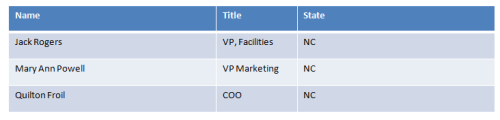
When merged, shows this data:
A slide may only contain one set of TableStart / TableEnd fields. Use “simple” field names within Detail Regions. Do not include DatasetName to refer to the dataset since the dataset is identified by the TableStart field. Change the color of the TableStart and TableEnd fields to help visually distinguish them from other merge fields. We suggest red.
Please follow these guidelines when creating a table-based Detail Region:
- A slide may contain only one detail region.
- If you have more rows of data than will fit on a slide, new slides will be generated to accommodate your data.
- PowerPoint does not have the ability to perform calculations (like =SUM(ABOVE)), so please use a formula field in Salesforce to perform calculations and merge the result into the table.
- PowerPoint does not support images within cells. If, however, you include an Image: merge field, the Conga will apply the image to the cell background. For more information, see Image Merge Fields.
- Do not use the “formal” field naming convention within tables, i.e., do not reference the DatasetName.