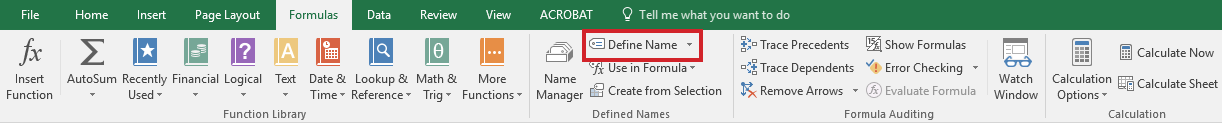
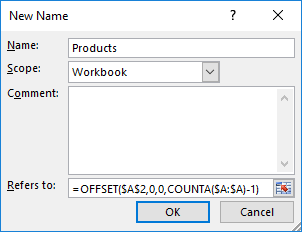
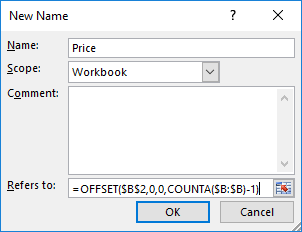
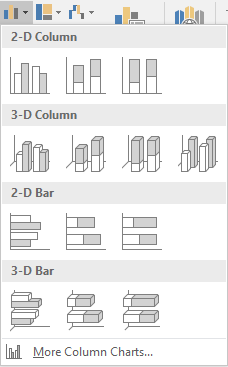
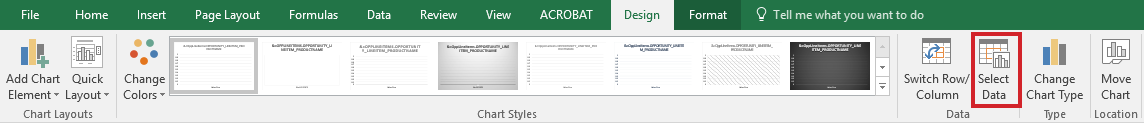
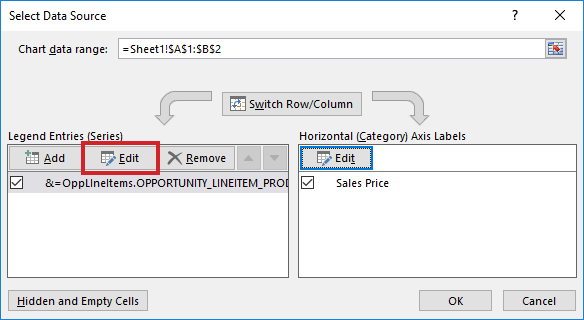
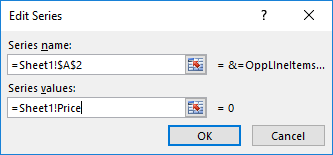
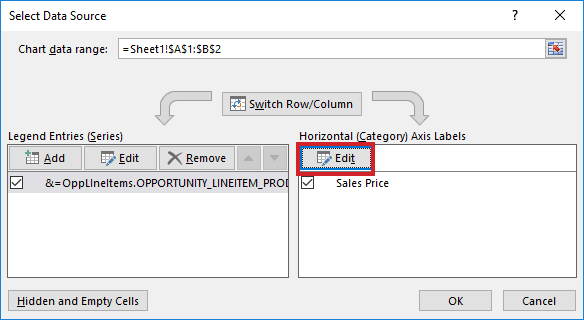
Composer Composer for Administrators Creating Composer Templates Excel Templates Advanced Excel Templates Current: Graphing in Excel PDF Download PDF Download page Graphing in Excel. Current page All pages Graphing in Excel This technique shows how to You can create dynamic graphs in Microsoft Excel. The indicated region expands with the merged data.To setup templates in Excel:In a new Excel worksheet, type the following information: (numeric) is required to ensure proper formatting of merge data numbers or currency values. On the Formulas tab, click Define Name in the Defined Names group.In the Name box, type: Products.In the Refers To box type =OFFSET($A$2,0,0,COUNTA($A:$A)-1) and then click OK.On the Formulas tab, click Define Name in the Defined Names group.In the Name box, type: Price.In the Refers To box type =OFFSET($B$2,0,0,COUNTA($B:$B)-1) and then click OK.In cell C1, type the following formula: =RAND()*0. This formula updates the OFFSET formulas in the defined names.Select cells A1:B2.On the Insert tab, click a chart, and then click a chart type.Click the Design tab click the Select Data in the Data group.Under Legend Entries (Series) click Edit.In the Series values box type =Sheet1!Price and click OK.Under Horizontal (Category) Axis Labels click Edit.In the Axis label range box type =Sheet1!Products and click OK.Save your workbook.On the Opportunity in Salesforce.com, click on your custom Composer button/link.Choose Select Template from your Local Computer and browse to your new workbook.Click Merge. ×