The Reports & Dashboards section offers pre-defined reports and dashboards customized for Conga CLM customers. Currently, there are four reports designed for Conga CLM users, and the record displayed under report and dashboard are specific to the tenant. Only users allowed by the product administrator can access this module. To learn more about Conga CLM reports, see Reports and Dashboard in Conga CLM for Users guide.

To access, click App Launcher () icon, go to Shared Apps, and then select Reports & Dashboards.

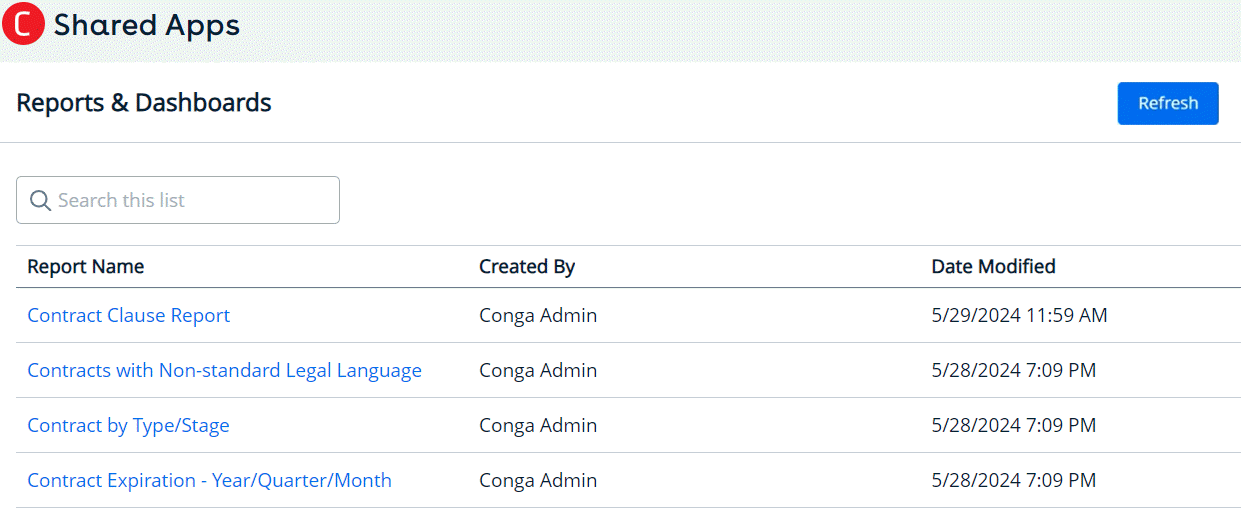
To ensure reporting data is available, you must perform a one-time migration for existing tenant data. Enable the Enable One-Time Migration for Reporting toggle in the organization details. For more information, see Viewing Conga Org Details.

After enabling, please wait for the setup to complete. Use the Refresh button to check the status of the data migration. If any issues arise, use the Retry button to try the migration again.

Clicking the report name link opens its dedicated dashboard. Within the dashboard, you have the flexibility to:

  • Apply Filters: Apply filters to specific fields for refining your data view within the report. For example, to view Corporate records, click the Contract by Type/Stage link, select the filter icon () to apply filters, and you can view only Corporate records.

  • Sort Data: Sort any available column and organize the dashboard information. You can choose between a table or list view.
  • DownloadExport the report data in various formats, such as JPEG (image), XLSX (Excel spreadsheet), or CSV (comma-separated values), for further analysis or sharing.

  • Search data: Search for specific data in a report

  • Display charts:  Different charts (Pie, Bar, Line, Histogram, Funnel, Scatterplot, Summaries) ) are displayed that graphically show your custom report data.

    Hover your mouse over a chart to display the details.