Use Conga Grid Graphs to visually analyze data in every Grid with custom graphs.
Conga Grid Graphs requires Conga Grid version 2.58 or higher.
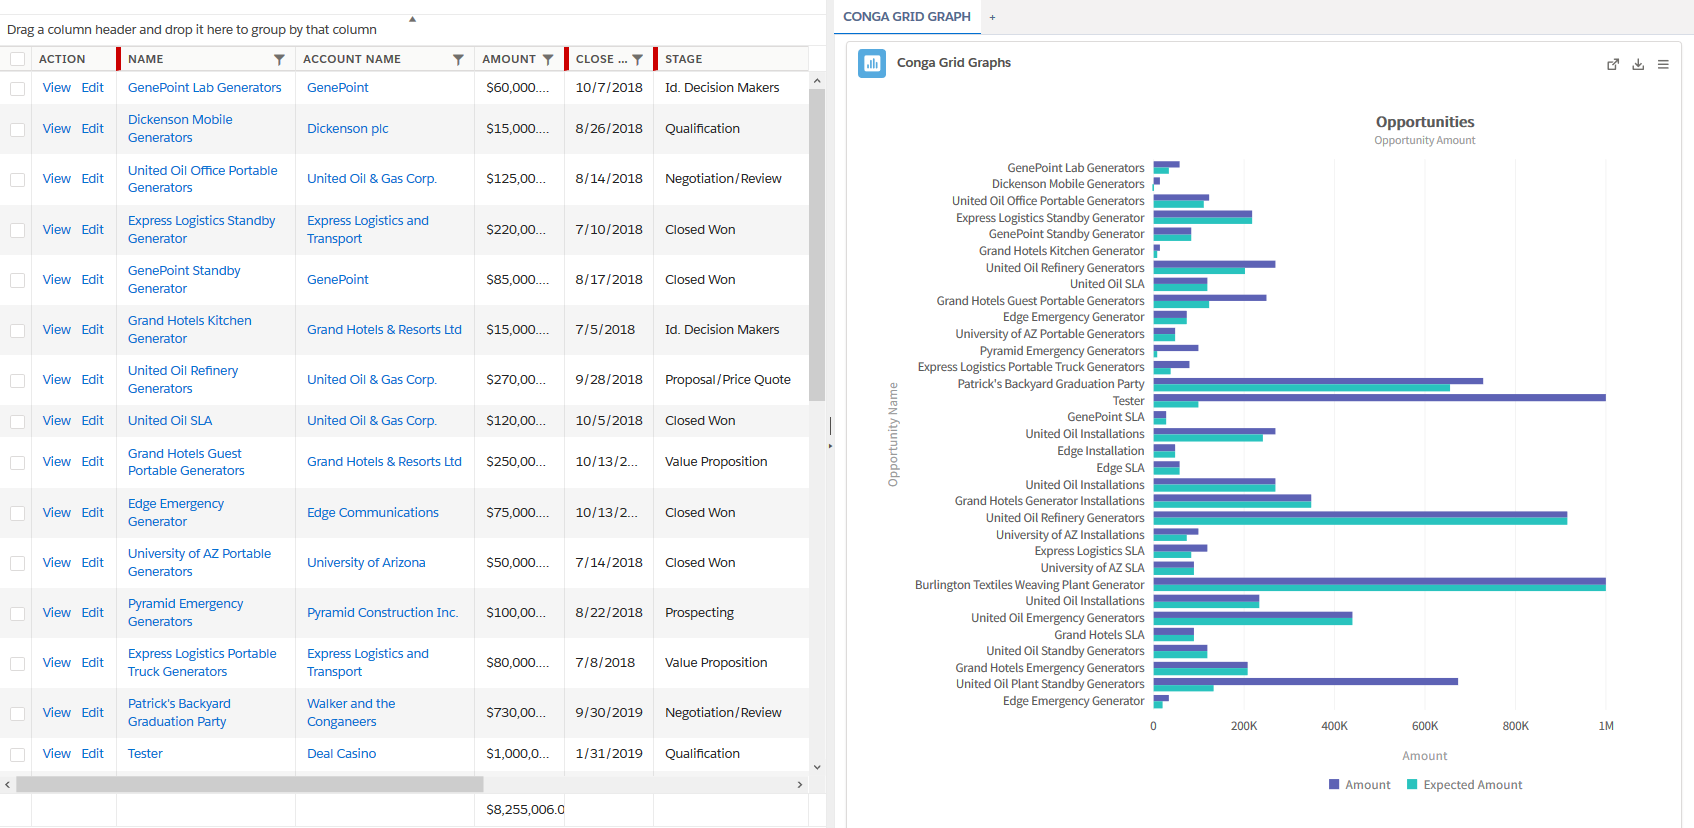
Users can easily add a Conga Grid Graph in the Reading Pane section of any Grid. For more information on how to setup and use Conga Grid Graphs, see Setting Up Conga Grid Graphs.
Graph Types
Conga Grid Graphs offers the following graph types:
Conga Grid Graphs allows users to select any field as the Category and one or multiple fields as the Series.
A Caption and Sub Caption are available for each individual graph to provide users with labels and additional context. Conga Grid Graphs also provides functionality to customize the labels and positioning for the X Axis, Y Axis, and Legend of each graph.
Users can also customize the Theme of their graph using Light, Pastel, and Dark themes.
Exporting a Grid Graph
Conga Grid also features the ability to easily export Conga Grid Graphs in the following files: