Perform the following steps to set up Conga Grid Graphs:
Upgrade to Conga Grid version 2.58 or the current version available on the Salesforce AppExchange.
Enable Grid Graphs in Conga Grid Setup.
Navigate to the Conga Grid Setup tab.
Click Global Defaults or a specific object to allow users to use Conga Grid Graphs on.
Click Feature Security.
Select the Enable radio button for the Conga Grid Graph feature and choose whether to apply to All Users, specific Profiles, or specific Users.
Display the Reading Pane in the selected Grid View to begin building a Conga Grid Graph.
Important
The Reading Pane is where Conga Grids displays the graph.
Easily add a Conga Grid Graph to your Grids to provide users with a visual analysis
Navigate to a Grid.
Click the gear wheel icon to open the Grid Configuration options.
Click the arrow next to Reading Pane to display the available features.
Check the check-box field next to Conga Grid Graph Tab.
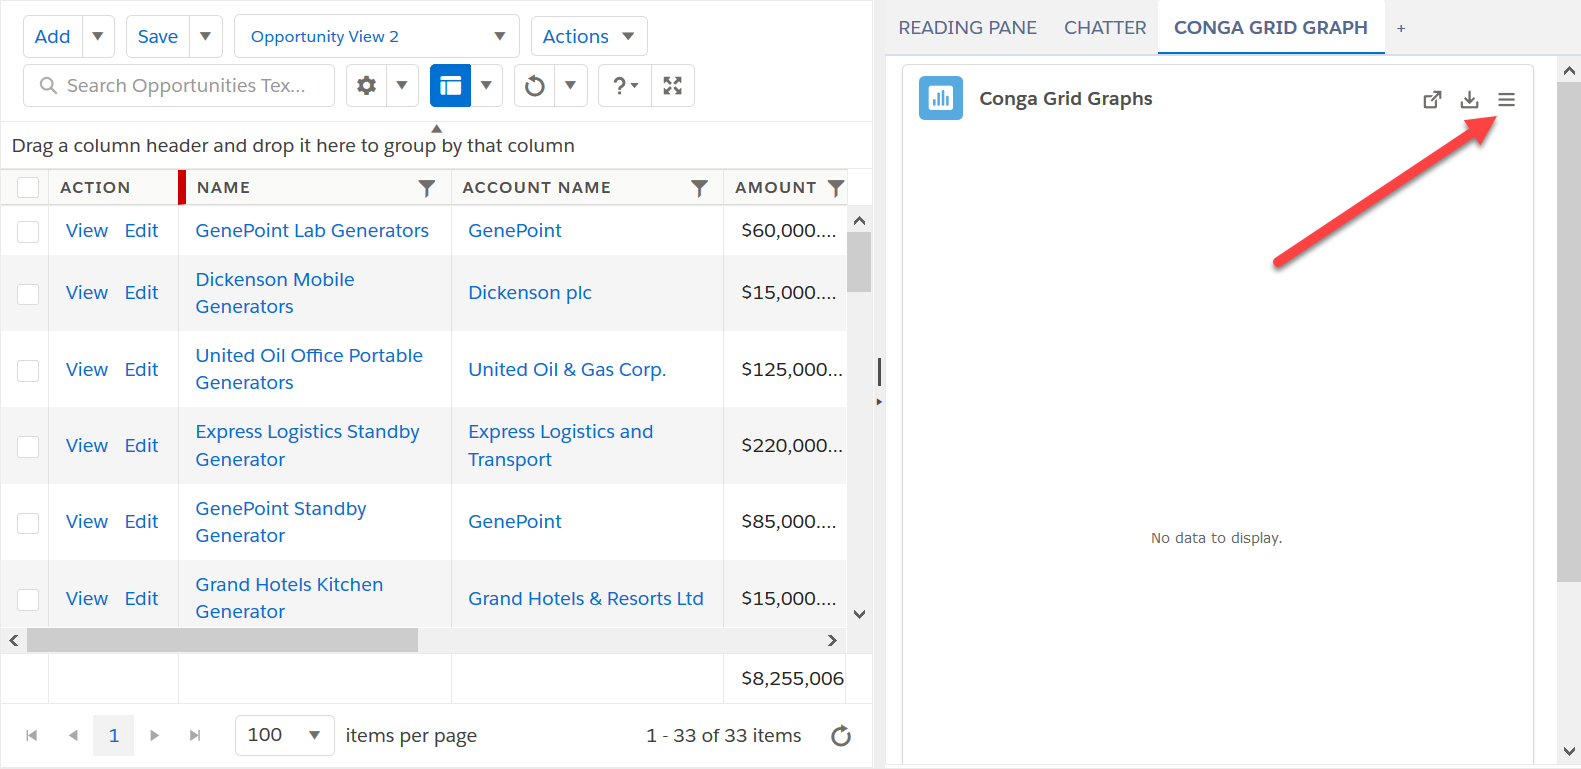
Open up the Reading Pane in the Grid and click the Conga Grid Graph tab.
Click the Conga Grid Graph Settings icon.
Select a Graph Type under the Settings tab. For more information on the different Graph Types, see Conga Grid Graph Types.
Click the Data tab and select a field for the Category and select a field(s) for the Series. Note: Users can select multiple fields depending on the graph type. For more information on field requirements for each graph type, see Conga Grid Graph Types.
(Optional) Click the Format tab to add additional formatting to the Conga Grid Graph.
Caption: adds entered text as a caption on the graph
Sub Caption: adds entered text as a sub caption on the graph
Caption Alignment: determines the caption alignment
X Axis Name: adds entered text as the X Axis Label
Y Axis Name: adds entered text as the Y Axis Label
Show Legend: displays a legend on the graph
Legend Caption: displays entered text as a caption for the legend
Legend Position: determines position of the legend
(Optional) Click the Theme tab to select a theme for the Conga Grid Graph.
Dark Mode: enables Dark Mode for the Conga Grid Graph user interface
Click one of the Light, Pastel or Dark themes to apply the theme to the Conga Grid Graph.
Click the Settings icon in the Conga Grid Graph window once all configurations are selected.
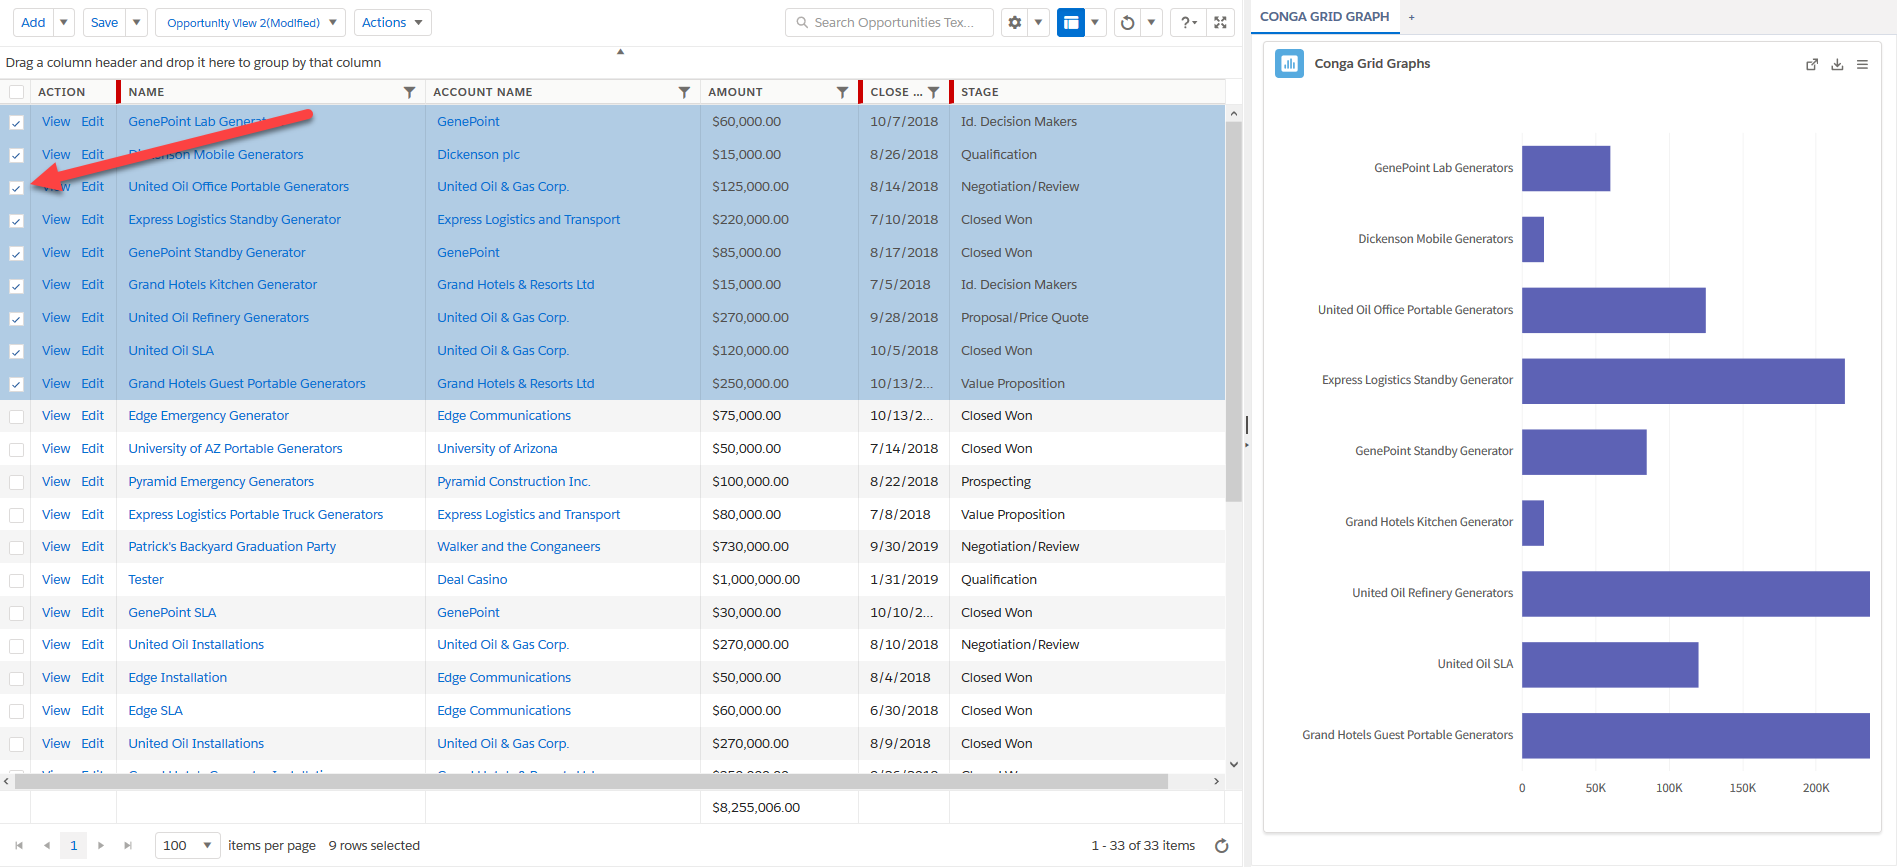
Select records to display in a graph.
Select specific records using the check box fields to left of each record.
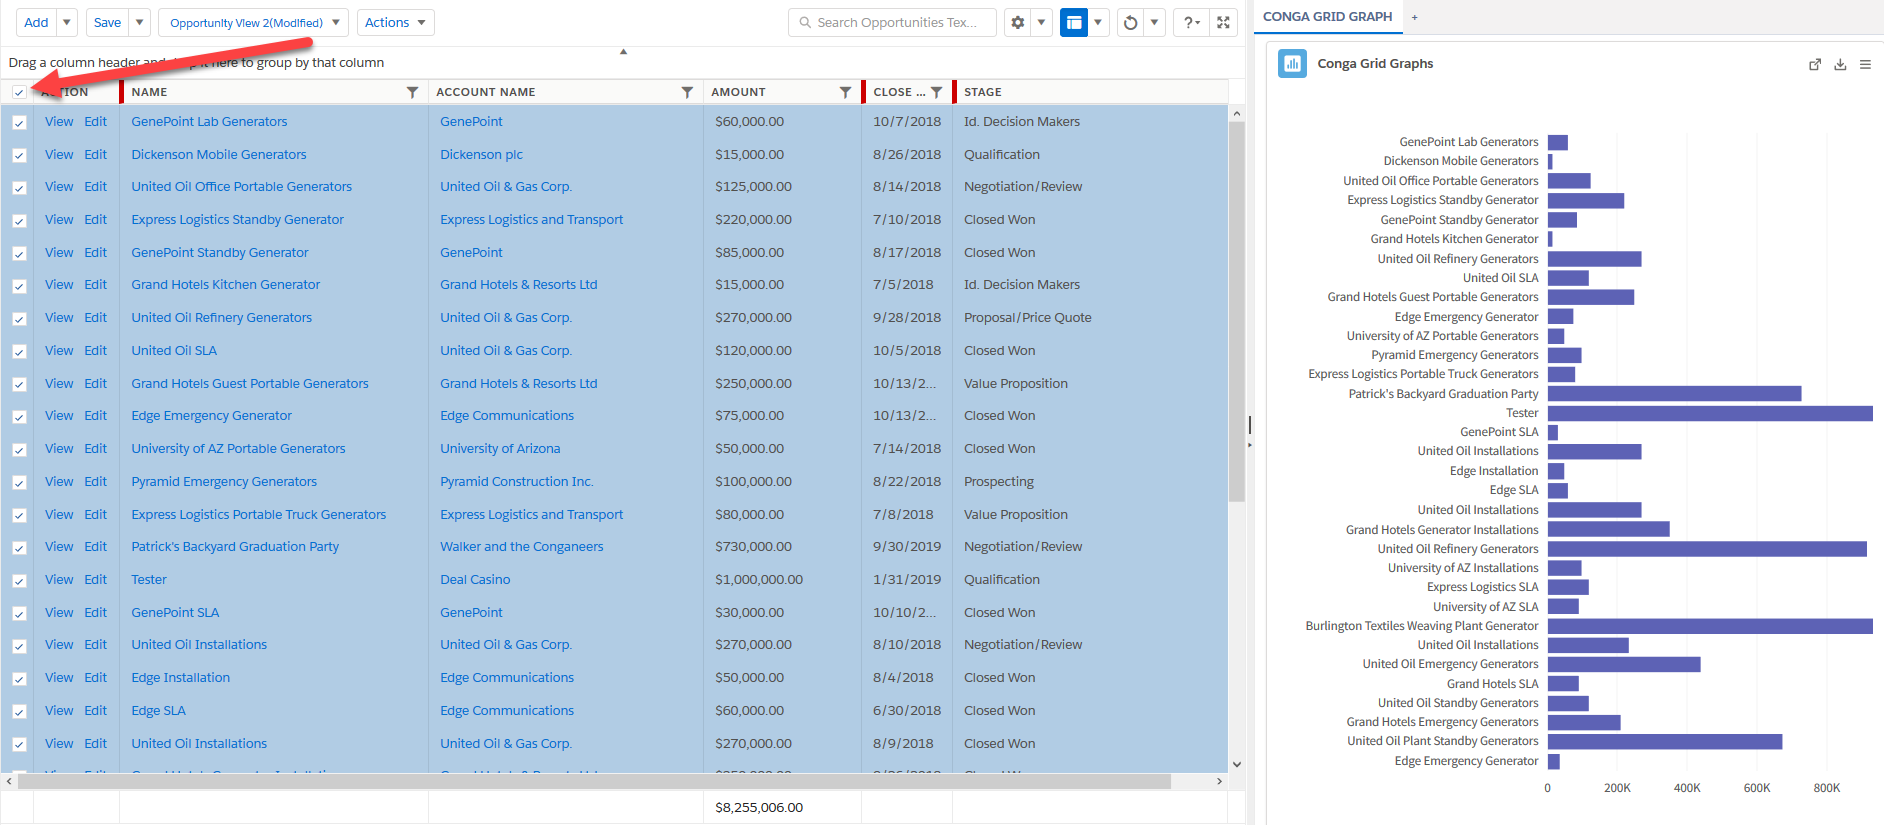
Select all records in the Grid using the All Records checkbox.
Save the View to display the Conga Grid Graph.
Click Save to save the Conga Grid Graph to the existing View.
Click the Save dropdown arrow and then select Save View As to save a new View that displays the Conga Grid Graph.