Download PDF
Download page Working with Display Maps.
Working with Display Maps
Use Display Maps to link fields to Excel cells for data that will be retrieved from your environment by an app. When data is retrieved from your environment by a query or similar action, this data is temporarily stored in Excel memory before it is placed into the worksheet. X-Author then uses a Display Map to place the data in the correct Excel cells. You use Display Actions in your app to implement Display Maps.
How many Display Maps you use is dependent on app design and the timing of data retrieval in your app. Remember the following when working with Display Maps:
- There is no limit to the number of Display Maps in a single app.
- A single Display Map can include fields from multiple objects.
- A single Display Map can be used across multiple worksheets (not workbooks).
Note
You do not need a Display Map if your app is not being designed to retrieve data from your environment. If you are retrieving data from your environment, then you need at least one Display Map per app.
Prerequisites
Before you can create a Display Map, you must have defined at least one object for your app. Refer to Adding Objects to your App for instructions.
Display Maps and Object Behavior
When you added objects to your app, you defined them as Individual (one record) or List (one or more records). When you map fields in a Display Map, you also choose whether the field type will be Individual or List. The behavior selected for an object determines how its fields are used in a Display Map.
Individual object fields can be placed anywhere in the worksheet except in the same row that contains fields from a List object.
List object fields must all be placed in the same row. This forms a List Range. List object fields do not need to be placed adjacent to each other, but there must be a start and end cell that represents the list range. For example, you could have mapped fields in A5, C5, and F5 with formulas in B5, D5, and E5.
You can find more information on Individual object fields and List object fields in the following sections.
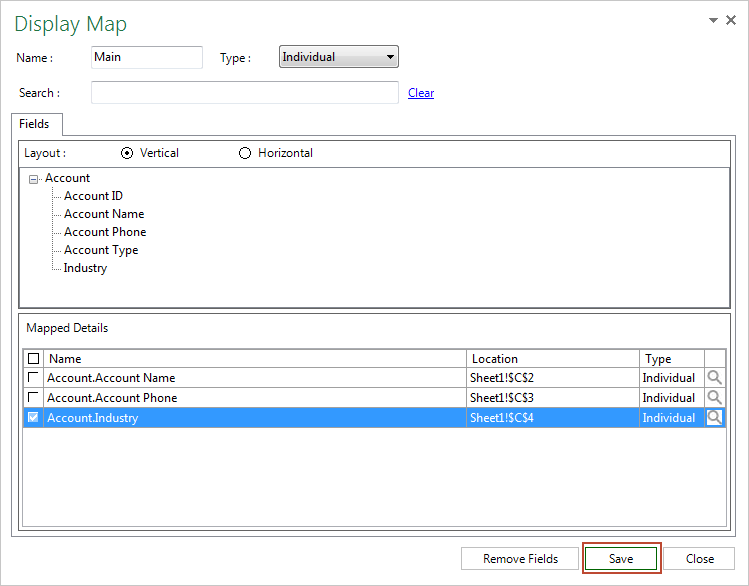
To create a Display Map for an Individual object
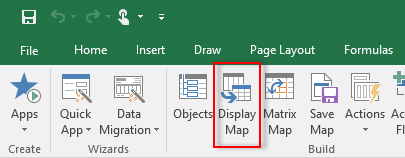
From, the X-Author Designer ribbon, click Display Map.
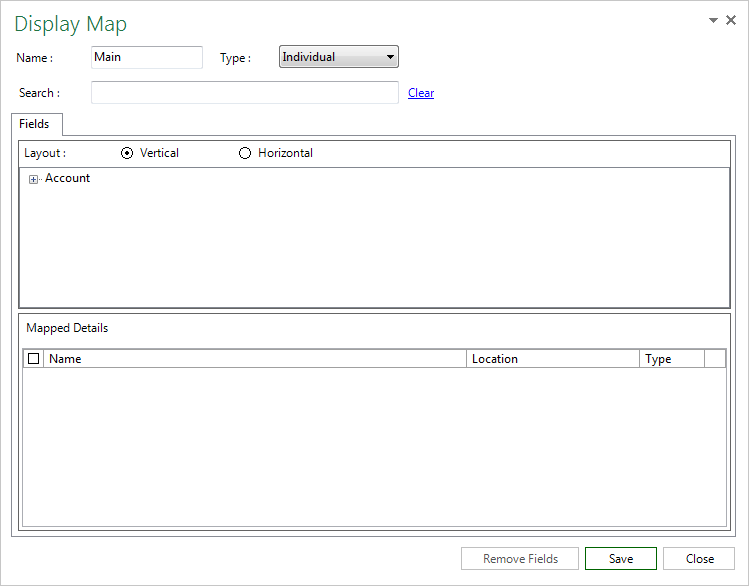
Click Create. The Display Map panel opens in Excel.
In the Name field, enter a name for your Display Map. Pick a name that makes it easy to distinguish from your other Display Maps.
Select Individual from the Type picklist.

Click the
 icon in the upper right-hand corner and choose an option to move or resize the Display Map panel.
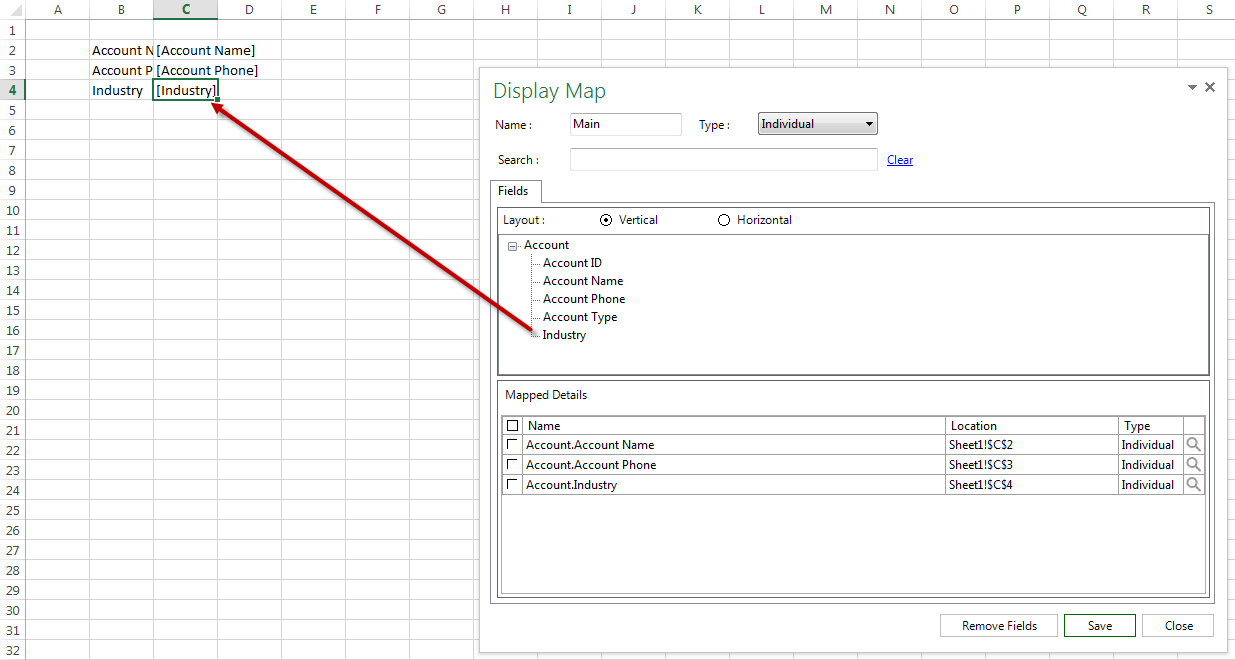
Add a field to the Display Map by dragging it from the Display Map panel and dropping it on the worksheet. The field label is automatically inserted into the cell directly to the left of the mapped cell. You can search for specific fields using the Search box.

Best Practice
To make the Display Map more appealing to the end user, highlight a cell containing a mapped field displayed in brackets and press the Delete key. Never delete rows to remove these values as it will corrupt the spreadsheet.
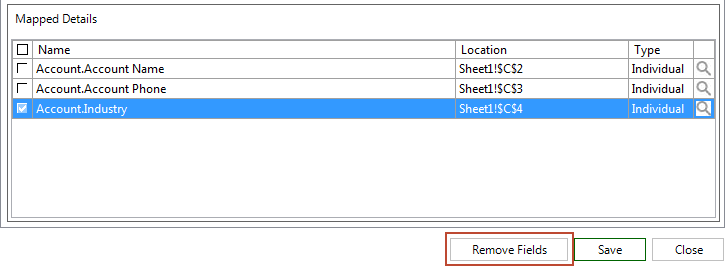
To remove a mapped field from the worksheet, select the check box next to the field in the Mapped Details section of the Display Map and click Remove Fields.
Display Map Look Aheads
You can click the magnify icon
 next to any mapped field to create a Look Ahead. This feature allows the runtime user to double-click on any cell in the retrieved list of data to lookup specific record values based on how you configure the Look Ahead. For information on the different types of Look Aheads and how to add them to your app design, refer to Creating Look Aheads in the Advanced App design section of this guide.
After you have mapped all Individual object fields to your worksheet, click Save.
Click Close.
Click Save App to save your app.
Watch a video tutorial on creating a Display Map and mapping Individual object fields.
To map List object fields to a Display Map
Note: In this task, you will map List fields to the same Display Map created in the previous task. You can also create a new Display Map for your List fields, but it is often easier, especially with parent-child apps, to use both Individual and List field types in your Display Map.
- From the X-Author Designer ribbon, click Display Map.
Click Edit. The Display Map panel opens in Excel.
Select List from the Type picklist. All List objects and fields defined in objects are displayed in the panel.
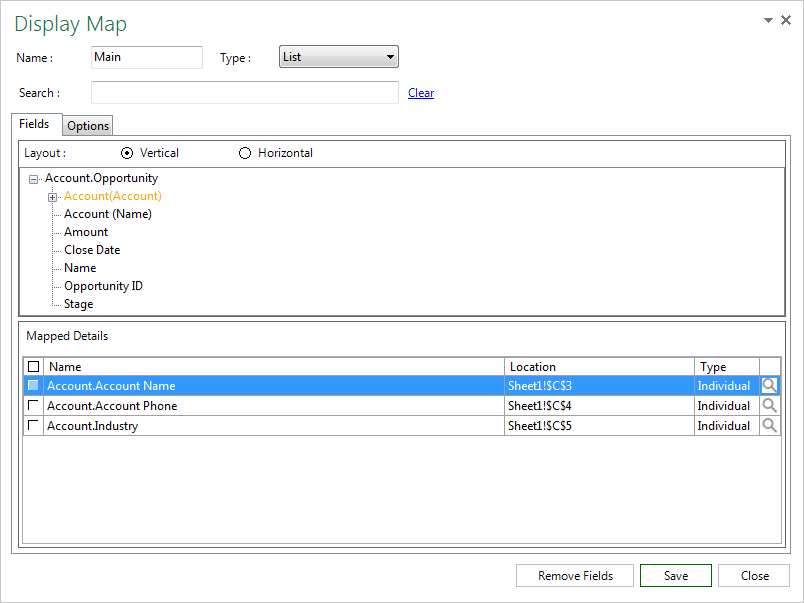
Select the Vertical check box so that the list of displayed records will be shown from top to bottom. Horizontal layouts are covered in a later section.
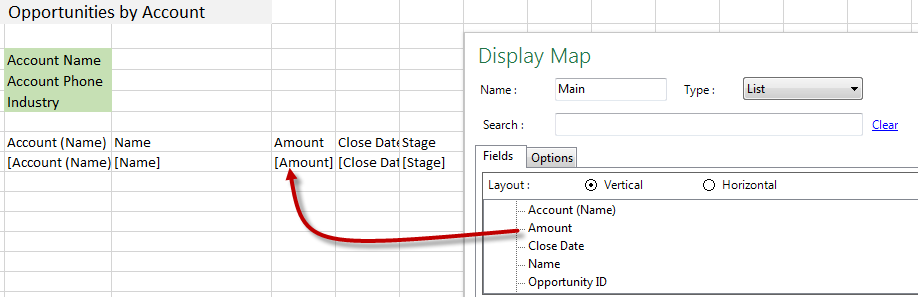
Add fields to the Display Map by dragging them from the Display Map panel and dropping them onto the worksheet in the same row. You can search for specific fields using the Search box. Fields are not required to be adjacent to each other, but there must be a start cell and end cell, which forms a List Range. You can also add fields from related objects (such as Account, if you are creating a list of Opportunities).
Working with List Ranges
The following rules and guidelines apply when you are mapping List Ranges:
Must include the record id if you are planning to save data - If you are planning to save back to your environment any data that has been retrieved into a List Range, you must include the record ID somewhere in the range. The best place to put this field is at the end of the range but it can be placed anywhere.
- The record ID is used to make sure that the Excel rows and environment records remain connected should the end user sort data in the range.
Formulas in a List Range - Formulas can be added into either mapped or non-mapped cells in a List Range.
- Formulas are inserted into the List Range cells as each record is retrieved into the worksheet via the Display Map.
- Formulas in cells where environment data is being retrieved and displayed will be overwritten by the environment data but are still very useful if you allow users to add rows. This is covered in Adding Rows to Worksheets.
List Rows are Inserted - As each List environment record is retrieved and displayed, an Excel row is inserted in the workbook.
- Anything you have placed below or alongside a List Range (for example: a total formula below the range or a pivot table), is pushed down accordingly.
Fields from related objects - Fields selected from related objects in the hierarchy can also be included on the same row in the List Range. You can select to save related object fields by including them in the Save Map. See Working with Save Maps for more information.
List Ranges for different objects - These can be created below other ranges or on other worksheets.
Grouping and sorting - Map fields that you want to group by at the left of the list range. See Grouping and Sorting List Ranges for more information.
Click Close.
Click Save App to save your app.
Rich Text Fields in List Ranges
You can insert Rich Text fields in the same way you enter any other field. Rich text fields appear to runtime users as a single link. The link opens an editor that allows the runtime user to modify the Rich Text field. Rich Text fields can only be edited by the runtime user if it is part of a list range (List object field). Rich Text fields of the SaveOnly type cannot be edited.
Watch a video tutorial on mapping List object fields to a Display Map.
Use Case: Sales Pipeline Display Map Part 1
Danny Designer is designing an app with Account, Opportunity and User objects for sales persons to use to manage their sales pipeline. He has already selected the objects for the app and now needs to create a Display Map to link data from his environment to the cells in the Excel workbook.
Danny takes the following steps to create a Display Map:
- Danny connects to his environment and opens the Sales Pipeline app.
- He clicks Display Map and clicks Create to start a new Display Map.
- Danny enters the name "Pipeline Main" for his Display Map and selects List from the Type drop-down.
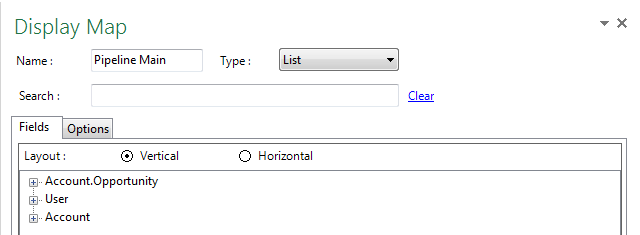
- Next, he drags and drops fields from the Account.Opportunity child object list to map them to the Display Map.
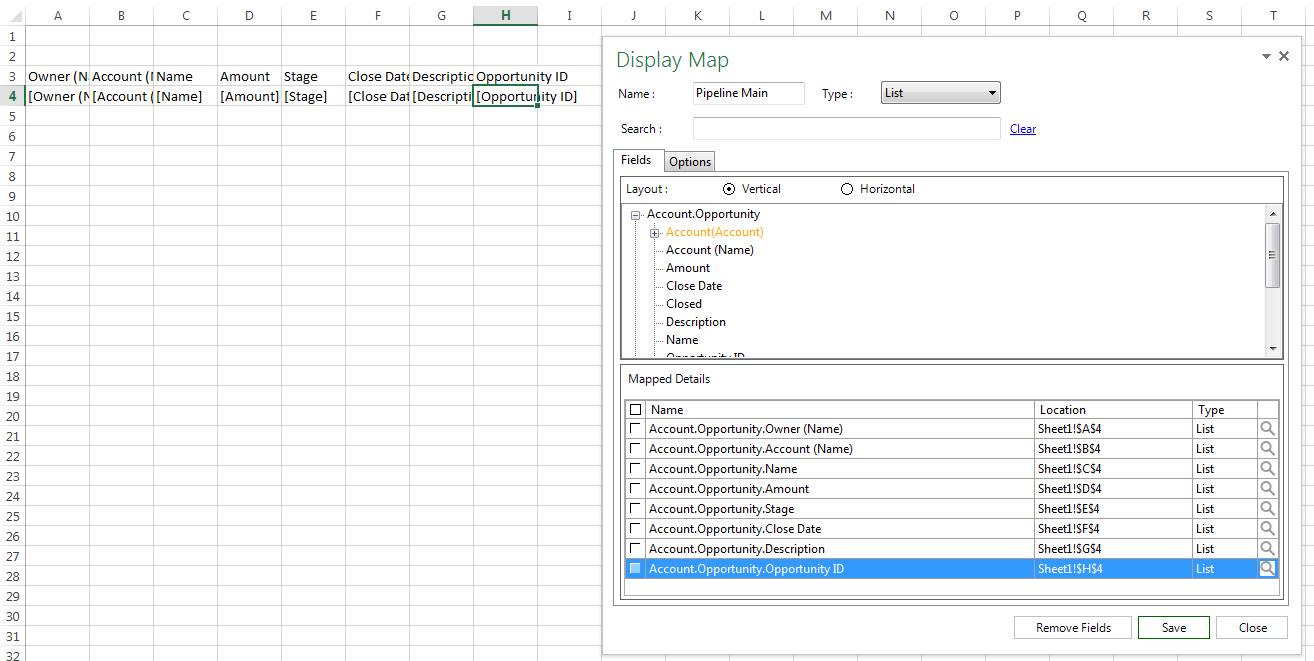
- Danny chooses to Hide column H. He added the field so that the user can save data back to the environment but he does not want to display it in the worksheet.
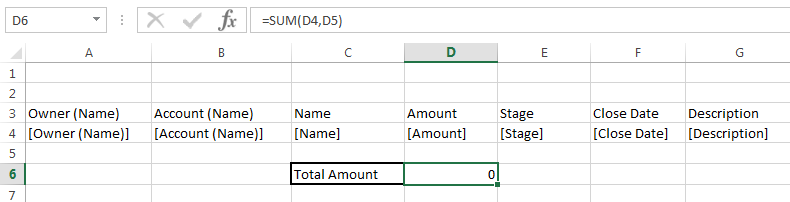
- Next, Danny adds a formula in D6 to SUM the Opportunity Amounts in D4.
- Danny clicks Save on the Display Map Panel and clicks Close.
- Danny clicks Save App to save all changes to the app.